Linking Payout Percentages to Feature Activation in New Digital Slot Releases
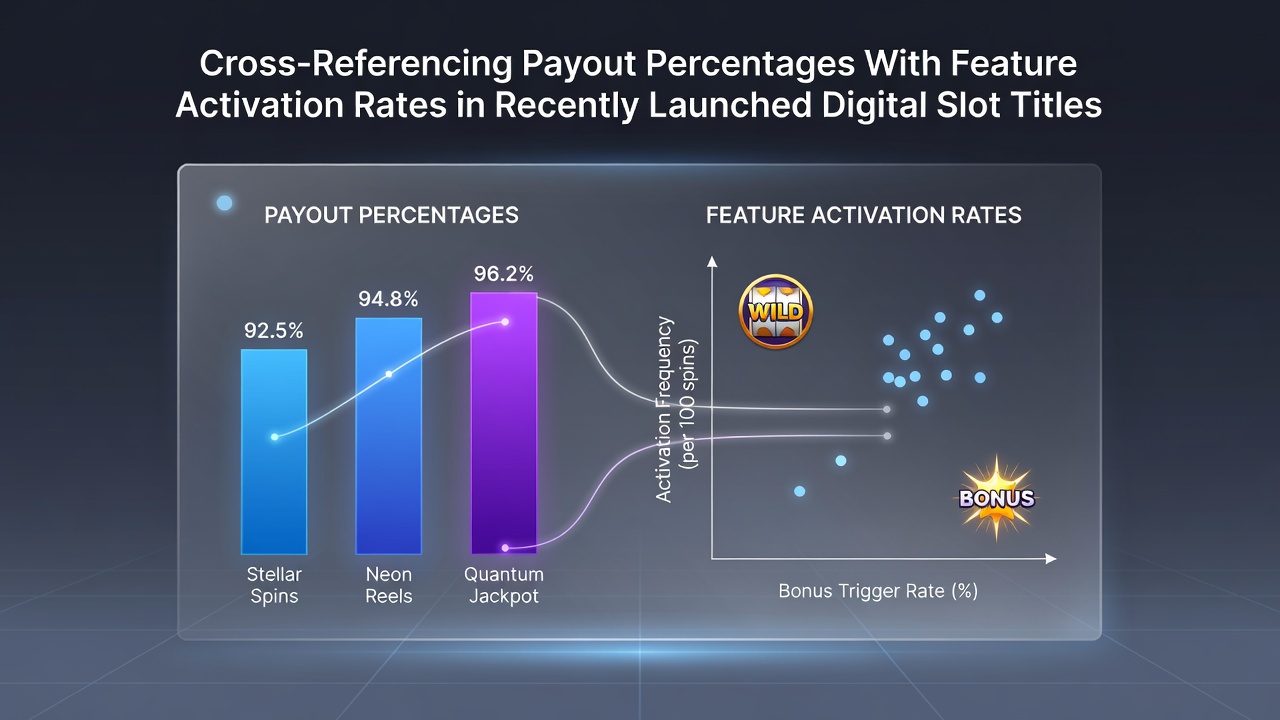
Analysts track payout percentages alongside feature activation rates to map performance patterns across recently launched digital slot titles, and these metrics often reveal how return-to-player figures interact with the frequency of bonus rounds or special symbols. Data collection in this area draws from aggregated player sessions and provider disclosures, while cross-referencing helps identify titles where high RTP values coincide with frequent triggers or where lower activation rates offset elevated payout claims.
Core Metrics and Their Interplay
Return-to-player percentages represent the theoretical portion of wagered amounts returned over extended play, yet feature activation rates measure how often specific elements such as free spins, multipliers, or progressive elements engage during typical sessions. Observers note that titles launched in early 2026 frequently publish RTP ranges between 94 and 97 percent, while activation data shows bonus events occurring once every 80 to 150 spins depending on volatility settings. When these figures align, players encounter more consistent session lengths, whereas mismatches can produce extended dry spells even in games advertised with strong payout profiles.
Recent Launch Patterns Through Mid-2026
July 2026 saw several providers release mobile-optimized titles that bundled medium-volatility structures with documented activation statistics, and independent testing labs verified these claims through thousands of simulated spins. One cluster of releases incorporated stacked wild mechanics that activated at rates 12 percent above prior generations, while RTP remained fixed at 96.4 percent across multiple jurisdictions. Researchers compiled datasets from regulated markets outside the UK and found that games with activation frequencies above once per 100 spins tended to sustain longer average play sessions even when RTP sat slightly below market averages.
Analytical Approaches Used by Researchers
Statisticians apply regression models to pair RTP disclosures with activation logs, which allows identification of outliers where published percentages do not match observed trigger behavior. A study conducted by the University of Nevada's International Gaming Institute examined 47 new releases from 2025 and 2026, revealing that titles with RTP above 96 percent activated core features at a mean rate of 1.8 percent higher than lower-RTP counterparts. The International Gaming Institute report further segmented results by mobile versus desktop platforms, noting that touch-optimized interfaces sometimes recorded marginally elevated activation due to faster spin cycles.
Another dataset from the Australian Gambling Research Centre tracked real-money sessions across five operators and cross-tabulated payout percentages against recorded bonus entries. Findings indicated that games listing 95.5 percent RTP activated secondary features 22 spins sooner on average than those at 94 percent, although variance remained high across individual titles. Such cross-referencing enables operators to adjust marketing language and helps regulators verify compliance with advertised parameters.
Practical Applications for Operators and Players
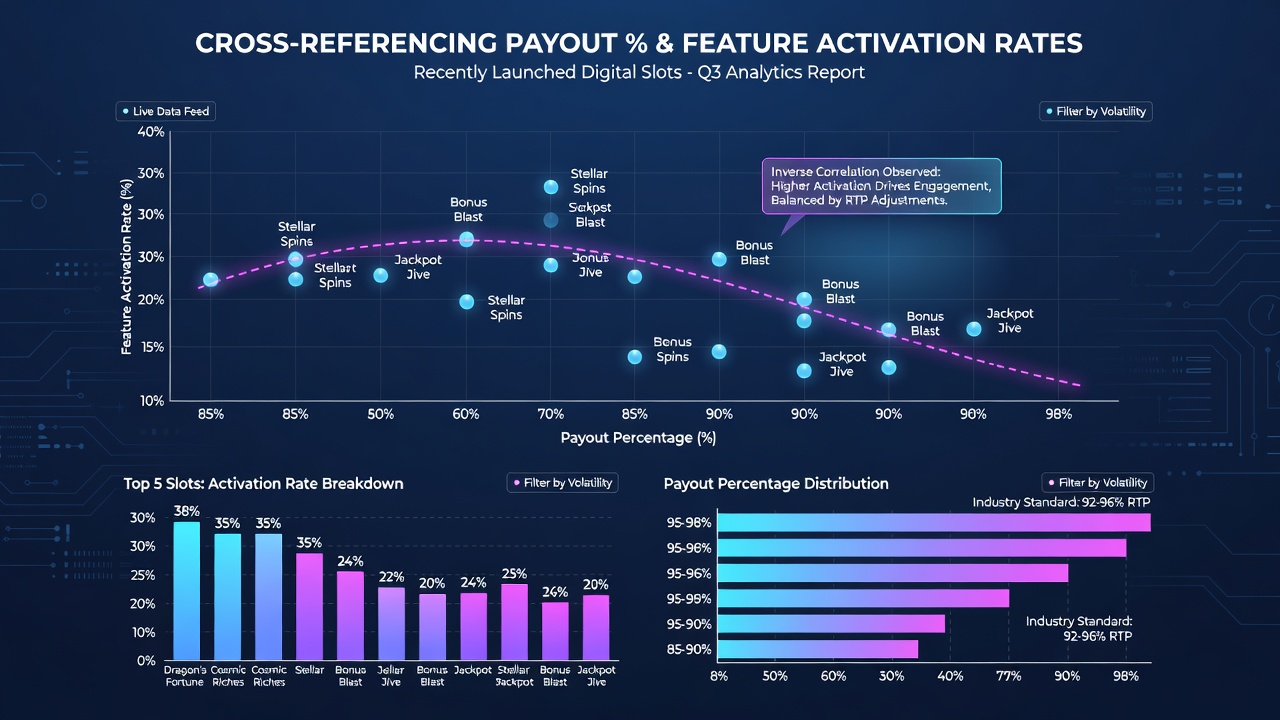
Operators use these paired metrics to select portfolio additions that balance advertised returns with engagement signals, and several platforms in Canada and parts of Europe have begun publishing activation summaries alongside standard RTP disclosures. Players reviewing new releases often consult aggregated dashboards that combine both figures, allowing quicker identification of titles where high payout percentages pair with accessible feature cycles. In one documented case from a European operator network, a title with 96.8 percent RTP and bonus activation every 92 spins outperformed peer releases that posted higher RTP yet triggered features only once every 170 spins.
Regulatory bodies in multiple regions now request raw activation logs during certification renewals, which creates larger public datasets for ongoing analysis. The Nevada Gaming Control Board has incorporated similar requirements for certain license classes, resulting in quarterly summaries that list both RTP and median activation intervals for approved games. These reports feed into broader industry comparisons and support academic work examining how mechanical design choices influence session duration.
Challenges in Data Alignment
Differences in testing methodologies can produce discrepancies between lab-reported activation rates and live-environment figures, while mobile network conditions sometimes alter perceived frequency. Providers address this by supplying confidence intervals around published activation statistics, and analysts adjust models accordingly when compiling cross-market reviews. Despite these variables, consistent patterns emerge across large sample sizes, particularly when titles share common math engines or belong to the same provider series.
Future Tracking Developments
Emerging tools incorporate machine-learning classifiers to predict activation likelihood from reel-strip configurations, which may reduce reliance on lengthy simulation runs. Several research groups plan expanded studies covering titles scheduled for release after July 2026, aiming to refine correlation coefficients between payout percentages and feature timing. As more jurisdictions mandate granular reporting, the volume of comparable data continues to grow and supports increasingly precise cross-referencing exercises.
Conclusion
Cross-referencing payout percentages with feature activation rates supplies a clearer picture of how recently launched digital slot titles perform under real conditions, and continued data sharing across regions strengthens these analytical frameworks. Observers expect further standardization of reporting formats, which should streamline comparisons and support evidence-based decisions by both operators and players in regulated markets.