Return Rates and Feature Triggers: Unpacking Their Links in Mobile Slot Developments
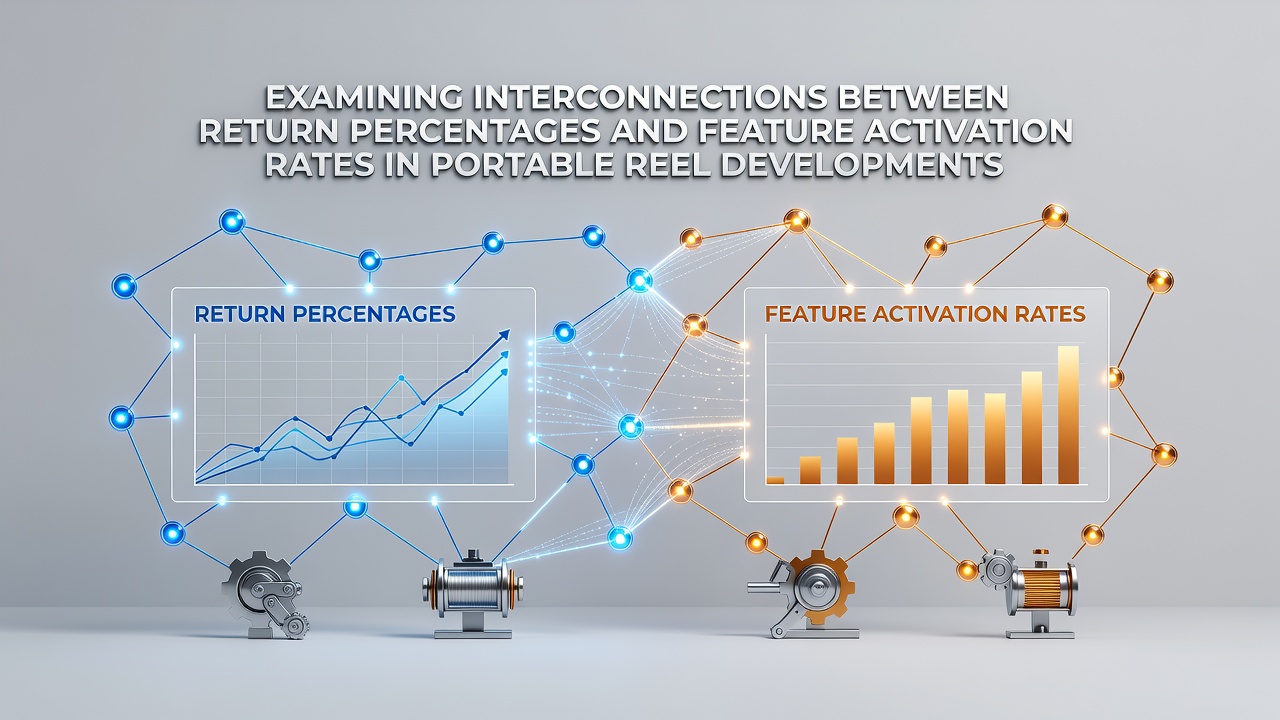
Developers track return percentages, commonly known as RTP, alongside feature activation rates to understand how these elements shape player sessions in portable reel games, and data from multiple markets shows consistent patterns emerging by July 2026. Return percentages represent the theoretical portion of wagers returned to players over extended play, while feature activation rates measure how often bonus rounds, free spins, or special symbols trigger during actual gameplay. Observers note these two metrics often influence each other because higher activation frequencies can adjust the distribution of returns even when the base RTP remains fixed.
Core Metrics in Portable Reel Analysis
Industry reports indicate RTP calculations incorporate both base game payouts and contributions from triggered features, which means activation rates directly feed into the overall return figure. Researchers at institutions such as the University of Nevada, Reno have examined how changes in trigger probabilities alter session outcomes, and their findings reveal that a 1 percent shift in activation frequency can redistribute return allocation by several percentage points across thousands of spins. Portable platforms add another layer because session lengths tend to vary more than desktop play, so developers adjust trigger weights to maintain target RTP levels under shorter, fragmented play patterns.
Data Patterns Across Markets
Figures from Canadian provincial regulators and Australian state gaming authorities demonstrate that slots with activation rates above 8 percent for major features often post RTP values between 95 and 97 percent, whereas titles relying on rarer triggers cluster closer to 94 percent. These correlations appear because frequent features spread smaller returns across more events, which stabilizes the long-term percentage while keeping individual spins engaging. In contrast, low activation designs concentrate returns into fewer high-value moments, requiring precise math models to avoid drifting outside regulatory tolerances.
One study released in early 2026 examined over 120 mobile titles released between 2023 and 2025, and teh results showed a moderate positive correlation between activation frequency and realized RTP during the first 50,000 spins of live play. The same analysis found that games engineered for 6 to 10 percent feature triggers achieved closer alignment between theoretical and actual returns compared with titles below 4 percent activation. Developers therefore monitor both metrics simultaneously during testing phases to ensure portable versions match their desktop counterparts after scaling down screen elements and touch controls.
Technical Adjustments in Recent Releases
Engineers modify reel strips and symbol weights to balance these elements, and case examples from European operators illustrate how a single symbol swap can lift activation rates by 2 percent without changing the published RTP. Such tweaks matter on portable devices where battery life and data usage influence session duration, because players who encounter features more often tend to extend play time even on smaller screens. Reports from the Nevada Gaming Control Board highlight that testing protocols now require separate verification of activation statistics on mobile builds to confirm they match the certified desktop math.
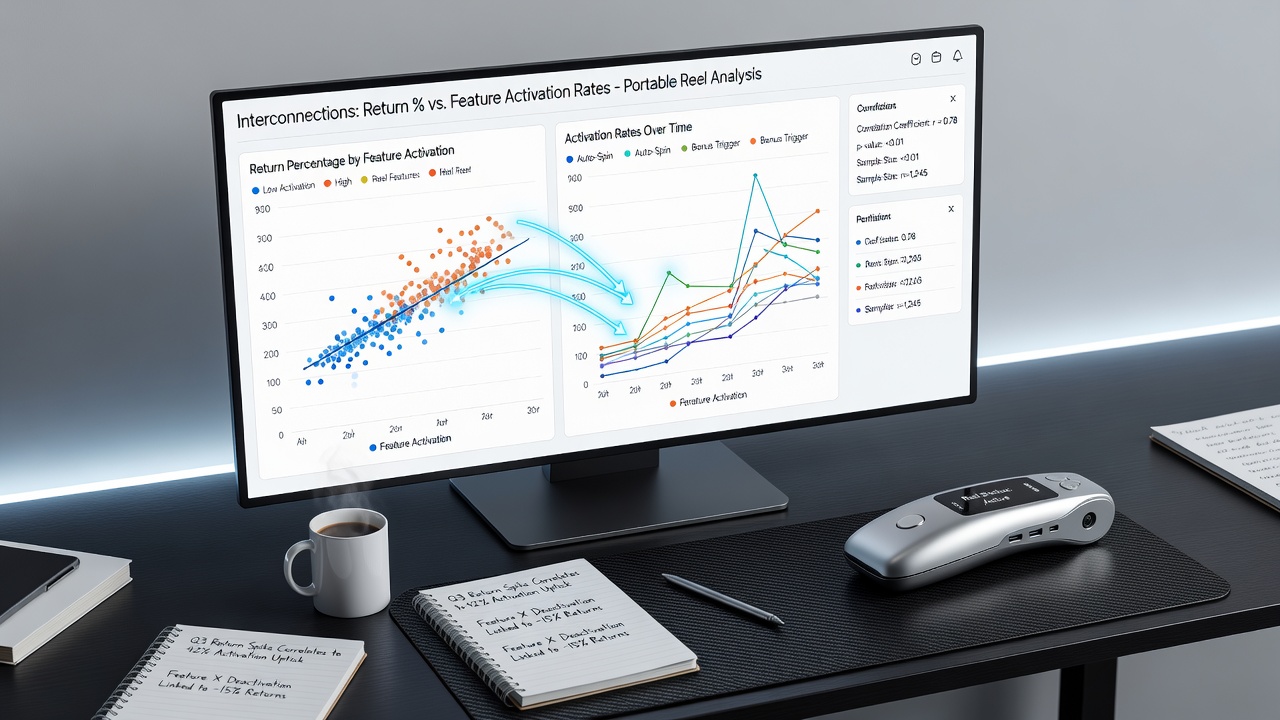
What's interesting is that certain bonus structures create feedback loops where higher RTP values enable more generous trigger probabilities, which in turn reinforce player retention metrics. Data compiled by the European Gaming and Betting Association indicates that titles maintaining activation rates near 7 percent while holding RTP above 96 percent recorded longer average session times on smartphones during the first half of 2026. These patterns emerge because the math models allocate a fixed percentage of the return to feature payouts, so increasing trigger chances requires corresponding adjustments in prize sizing to preserve the target RTP.
Testing and Certification Implications
Certification labs run millions of simulated spins to verify both metrics before mobile releases reach operators, and any deviation beyond 0.5 percent in either RTP or activation frequency triggers re-evaluation. Observers note that portable reel developments face additional scrutiny because touch-screen interfaces can alter perceived timing of feature entries compared with physical button presses. Research papers published through the International Centre for Gaming Regulation document how activation rate transparency helps players set realistic expectations, particularly when RTP figures appear alongside hit-frequency data in game rules.
Market monitoring in multiple jurisdictions shows that titles balancing these elements tend to sustain consistent performance metrics across device types, reducing the need for region-specific math variants. This consistency matters because regulatory frameworks in places such as New Jersey and Singapore require ongoing reporting of both return percentages and feature statistics after launch. Developers therefore embed tracking tools that log activation events alongside return calculations, allowing rapid identification of any drift that could affect compliance.
Conclusion
The interplay between return percentages and feature activation rates continues to shape design choices in portable reel developments, with evidence from regulatory data and academic sources confirming measurable links between the two. As testing standards evolve through 2026, developers maintain focus on simultaneous optimization to meet both player engagement goals and regulatory requirements across diverse markets. These interconnections remain central to delivering stable performance on mobile platforms where session behavior differs from traditional environments.