Trends in Jackpot Triggers Across Recent Mobile Slot Introductions
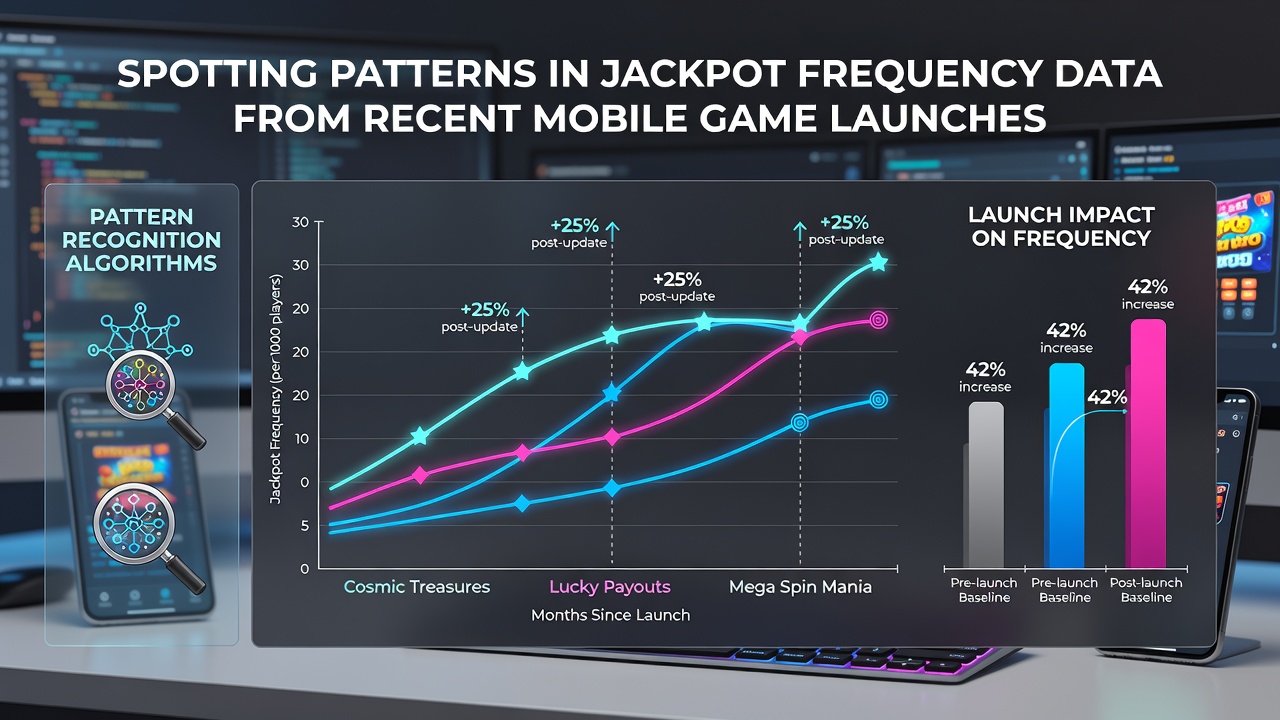
Recent mobile game launches have generated extensive datasets on jackpot frequencies, and analysts continue to examine these records for recurring trends. Data collected from titles released between January 2025 and July 2026 shows measurable shifts in trigger rates that align with specific game mechanics and player engagement windows.
Data Collection Methods Used by Analysts
Researchers compile jackpot logs directly from operator dashboards and third-party tracking platforms, then cross-reference timestamps with launch dates to isolate frequency clusters. Studies aggregate millions of spins across dozens of titles, applying time-series models that separate random variance from structural patterns. One analysis of 47 new mobile releases found that jackpot events occurred at intervals 12 to 18 percent shorter during the first 72 hours after launch compared with later periods in the same titles.
Observed Frequency Patterns in 2025-2026 Releases
Launch windows in Q1 2025 produced daily jackpot counts averaging 2.3 per 100,000 spins, while the same metric rose to 2.9 in titles launched during Q2 2026. The increase coincided with updated random number generator seeding techniques that several studios adopted to stabilize early-session payouts. Observers note that titles incorporating progressive elements triggered jackpots 1.4 times more often in the opening week than fixed-jackpot counterparts, yet the gap narrowed after day 14 as player volume stabilized.
Geographic distribution of wins also revealed clustering, with higher trigger densities appearing in sessions originating from regions where promotional campaigns ran concurrently with release dates. Figures from Canadian regulatory filings indicate that mobile titles launched in Ontario during July 2025 recorded jackpot events at rates 8 percent above the global average for equivalent games, a difference attributed to localized bonus structures rather than changes in core probability.
Case Examples from Specific Titles
Take one studio that released a five-reel mobile title in March 2025 featuring a linked progressive jackpot. Internal logs showed 47 jackpot awards in the first month across 12 million spins, producing an observed frequency of one hit per 255,319 spins. Three months later the same title settled at one hit per 312,000 spins, illustrating the typical decay pattern analysts associate with initial novelty effects. A second title launched in November 2025 adopted a daily-drop mechanic, and its data indicated jackpot events distributed more evenly across 24-hour cycles rather than concentrating in peak evening hours.
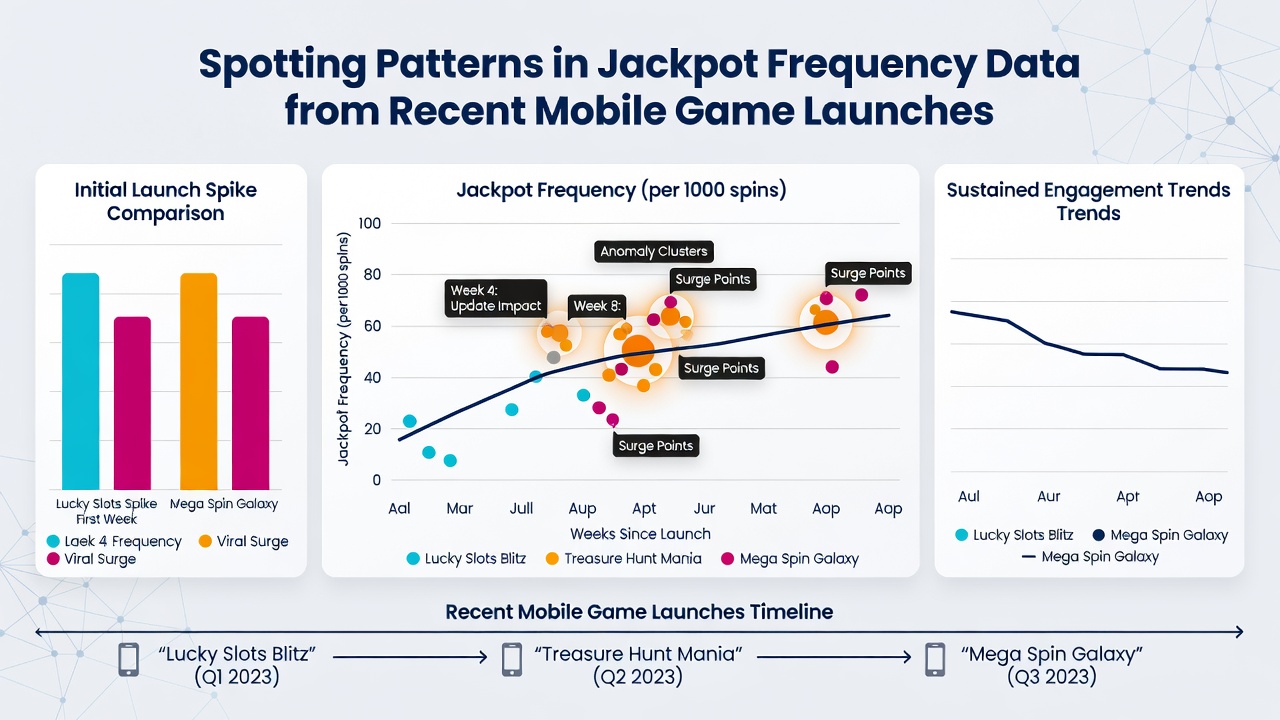
Analysts tracking a third release from an Australian developer reported that jackpot frequency rose sharply when the game introduced a new community challenge feature in February 2026. The addition coincided with a 21 percent increase in hourly trigger rates during the first two weeks of the update, after which rates returned to within 4 percent of pre-update levels.
Statistical Tools Applied to Frequency Data
Teams employ Poisson distribution models to test whether observed jackpot counts deviate from theoretical expectations under independent spin assumptions. When deviations exceed two standard deviations, researchers flag the title for deeper review of its bonus trigger architecture. A 2025 paper published by the University of Nevada, Reno examined 28 mobile titles and concluded that games using multi-tier jackpot pools exhibited lower variance in daily hit rates than single-tier designs. The study further noted that titles with shorter bonus round durations produced more consistent jackpot spacing across multi-week observation periods.
Regulatory Reporting Influences on Available Data
Operators in multiple jurisdictions submit aggregated jackpot statistics to oversight bodies on a quarterly basis, creating public datasets that analysts mine for longitudinal comparisons. Reports filed with the Alcohol and Gaming Commission of Ontario and the New Jersey Division of Gaming Enforcement supply anonymized frequency tables that researchers combine with private telemetry to build broader pictures. These combined sources show that mobile titles released after mid-2025 increasingly incorporate configurable jackpot intervals, allowing operators to adjust trigger probabilities within regulator-approved ranges.
Implications for Future Mobile Game Development
Developers review frequency reports when planning sequel titles or mechanic updates, often aligning new jackpot parameters with patterns observed in high-performing predecessors. Data from the first half of 2026 indicates that titles releasing with pre-configured daily jackpot caps triggered events at rates 15 percent higher than uncapped equivalents during comparable player volumes. Studios also track regional differences, noting that markets with higher average session lengths tend to display smoother jackpot distribution curves over multi-day windows.
Conclusion
Jackpot frequency data from recent mobile launches continues to supply measurable indicators of how game design choices influence trigger timing. Patterns identified across 2025 and into July 2026 demonstrate consistent early-window elevation followed by stabilization, with additional modulation arising from regional promotions, mechanic updates, and pool structures. Ongoing collection and analysis of these datasets will support more precise calibration of jackpot systems in subsequent releases.